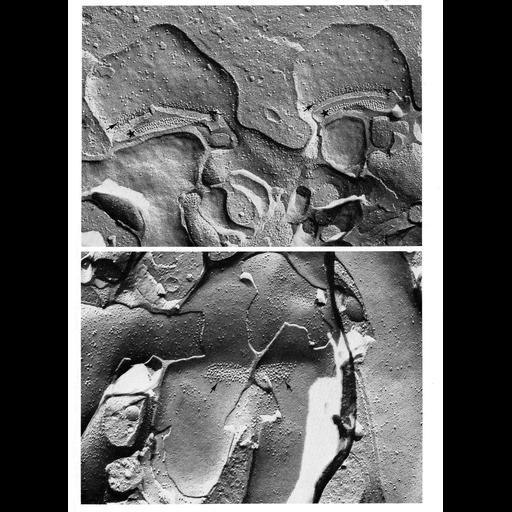
Freeze fracture images of synaptic junctions in the retina of Macaca mulatta. The electron micrograph in the top panel shows two invaginating synapses between cone and horizontal cells in the outer plexiform layer of the retina. Arrows indicate regions of particle aggregation on the presynaptic side, candidate channels associated with vesicle release), the stars point to exposed internal specializations, candidate receptor sites, on the postsynaptic plasma membrane. The micrograph in the lower panel shows two postsynaptic processes of a dyad synapse in the inner plexiform layer. Arrows indicate aggregations of particles associated with the e-face of the freeze fracture replica. Upper micrograph reprinted from E. Raviola and N. B. Gilula, J. Cell Biol, 1975); lower micrograph courtesy of E. Raviola and G. Raviola. Figure 10 from Chapter 1 (The Cell Surface) of 'The Cell, 2nd Ed.' by Don W. Fawcett M.D. A PDF copy of the accompanying chapter is available on the ASCB's BioEDUCATE website.
With the freeze-fracture technique, tissue is rapidly frozen and cracked to shear along zones of weakness. Cleavage of membranes occurs along the hydrophobic interior of the lipid bilayer to reveal views of a "p-face" (the outwardly-facing inner half of the membrane) and an "e-face" (the inwardly-facing outer half of the membrane), and a metallic replica is made of the fractured surface. The intramembranous particles represent integral membrane proteins.
| Spatial Axis | Image Size | Pixel Size |
|---|---|---|
| X | 982px | —— |
| Y | 1340px | —— |