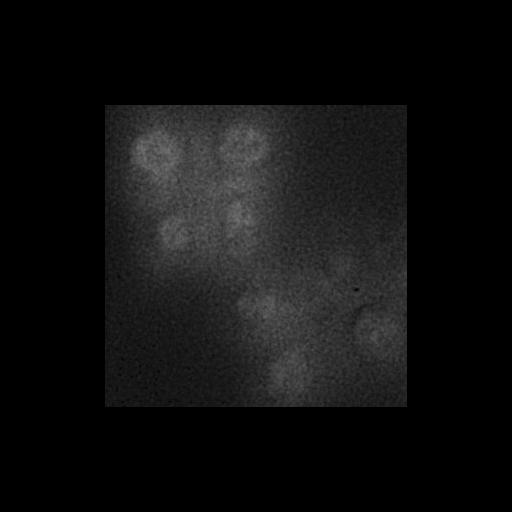
Intracellular localization of GFP-GOLPH3 in BY4742 sac1∆ vps74∆. SAC1 encodes an integral membrane phosphoinositide phosphatase that is localized to the ER and Golgi. In the sac1∆ vps74∆ mutant, GFP-GOLPH3 localizes, in addition to the Golgi apparatus, to nuclear ER and cortical ER and/or PM. Thus, correct Golgi localization of Vps74 (see CIL# 24812 for GFP-Vps74 in sac1∆ vps74∆ mutant) and GOLPH3 requires synthesis of PtdIns4P in the Golgi by Pik1-Frq1 and maintenance of low PtdIns4P levels in non-Golgi membranes by the Sac1 lipid phosphatase. Cells grown in liquid medium were mounted in growth medium and 3D image stacks were collected at 0.4-µm z increments on a DeltaVision workstation (Applied Precision) based on an inverted microscope (IX-70; Olympus) using a 100× NA 1.4 oil immersion lens. Images were captured at 23C with a 12-bit CCD camera (CoolSnap HQ; Photometrics) and deconvolved using the iterative-constrained algorithm (Agard, 1984) and the measured point spread function. One image from the approximate center of z stack is shown in Fig1B GOLPH3/sac1∆ panel in J Cell Biol. 187: 967-975. 2009. Images in Fig 1B include CIL#s 24815, 24812, 24813.
| Spatial Axis | Image Size | Pixel Size |
|---|---|---|
| X | 302px | 0.0663µm |
| Y | 302px | 0.0663µm |
| Z | 16px | 0.4µm |