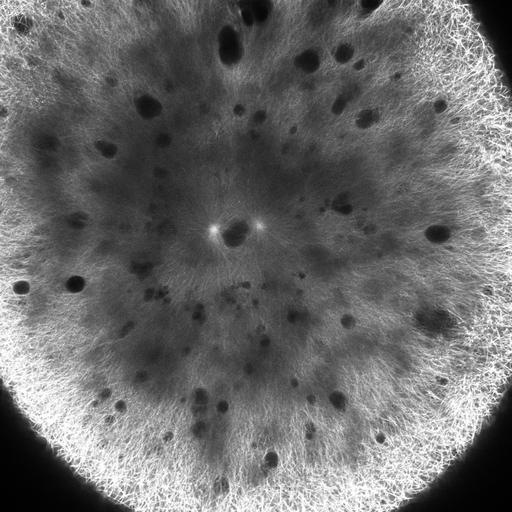
Zebrafish embryo stably expressing the microtubule-binding domain of ensconsin fused to three GFPs (EMTB-3GFP). Astral microtubules at metaphase are too short to contact the cortex, and the spindle forms where centrosomes and DNA were deposited by the sperm aster. After anaphase onset, telophase asters expand dramatically from the separating sister centrosomes. At the plane where the sister telophase asters overlap, a zone of reduced microtubule density emerges. We will call this region the aster-aster interaction zone. The interaction zone limits the length of microtubules growing toward the sister aster, creating a length asymmetry in the left to right direction. As the telophase asters expand, and before astral microtubules reach the cortex, the centrosomes at their centers start to move apart, toward a point midway between the interaction zone and the far cortex. This corresponds to the presumptive center of the daughter cell following cytokinesis, where the second mitotic spindle must assemble. The aster expands at approximately 15 mm per minute, while centrosomes move away from the midplane at approximately 3 mm per minute. During their outward movement, the centrosomes duplicate and separate, and each pair orients parallel to the interaction zone, aligning with the long axes of the telophase asters. Interphase nuclei follow centrosomes. The spindles of second mitosis assemble between the separated centrosomes, shortly after cytokinesis. Images collected on a Zeiss LSM 710 using a 20X 1.0 NA water dipping lense. Corresponds to Video1 in Current Biology 20, 2040-2045, 2010.
| Spatial Axis | Image Size | Pixel Size |
|---|---|---|
| X | 2572px | 0.1653µm |
| Y | 2572px | 0.1653µm |
| Channel | Wavelength | |
|---|---|---|
| 1 | 488nm |
| Time | 90 seconds | 47 |
|---|