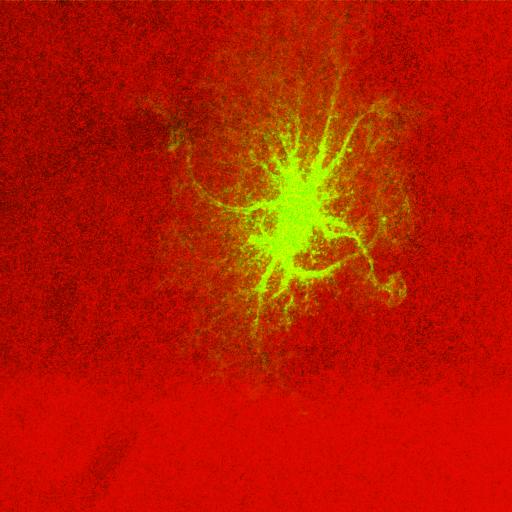
Projection through merged optical section series of the astrocyte filled with AlexaFluor 568 (green) in the molecular layer of the dentate gyrus, stained with AlexaFluor 488 to reveal N-CAM (red), showing the relationship between astrocyte processes and laminar boundaries revealed by N-CAM staining. Contrast was enhanced for better viewing.
Full resolution image description
Zip file containing the merged channel file in tiff format.
slc7as2_merger.tif.zip
Volume_dimension
1024, 1024, 35
Volume scale
0.16, 0.16, 0.28
Animation description
Animation through the optical sections of a confocal data set showing the relationship of the astrocyte filled with AlexaFluor 568 (green) to laminar boundaries in the dentate gyrus revealed by staining N-CAM with AlexaFluor 488(red) immunolabeling. the animation has been downsampled from the original data for ease of display.
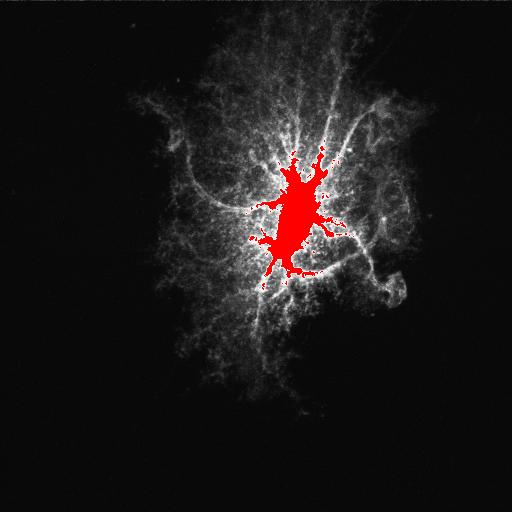
Projection through optical section series of the astrocyte filled with AlexaFluor 568 in the adult rat dentate gyrus. Saturated pixels are displayed in red. This section was also double labeled with AlexaFluor 488 to reveal N-CAM (see merged image under reconstruction).
Full resolution image description
Zip file containing original optical section series through a protoplasmic astrocyte injected with AlexaFluor 568(slc7as2_ly.pic) in dentate gyrus where N-CAM was labeled with AlexaFluor 488 (slc7as2_ncam.pic). Each label is in a separate file. The merged file is available for download under "Reconstruction."
Animation description
Animation through optical section series of the astrocyte filled with AlexaFluor 568 in the molecular layer of the adult rat dentate gyrus imaged using confocal microscopy. Tissue was immunolabeled with AlexaFluor 488 to reveal N-CAM (merged data set is under "Reconstruction")
Relationship between astrocyte distribution & morpholgy and laminar boundaries in the dentate gyrus
Funding agency
National Institutes of Health
Leader(s)
Eric Bushong
Collaborator(s)
Maryann Martone
Mark Ellisman
Start date
03-01-2000
End date
03-01-2000
Experiment
Experiment ID
3453
Title
Exp7
Purpose
To investigate the relationship of filled astrocytes to laminar boundaries in the dentate gyrus revealed by N-CAM immunostaining
Experimenter(s)
Eric Bushong
Microscopy product
Microscopy product ID
3800
Instrument
BioRad 1024 MRC Confocal
Microscopy type
laser scanning confocal
Product type
OPTICAL SECTION
Image basename
slc7as2
Spatial Axis
Image Size
Pixel Size
X
1024px
0.16 um/pixels
Y
1024px
0.16 um/pixels
Subject
Species
rat
Scientific name
rattus norvegicus
Strain
Sprague-Dawley
Age
1 months
Age class
young adult
Tissue section
Anatomical location
hippocampus
Microtome
vibratome
Thickness
75 µm
Specimen description
Organ
brain
System
central nervous system
Cell type
protoplasmic astrocyte
Imaging parameters
Type
Light microscopy product
Immersion medium
oil
Mounting medium
gelvatol
Lens magnification
X
Numerical aperture
1.4
Notes
dkloos
Specimen preparation
Protocol used
MaterialsThe rabbit anti-EphA4 antibody recognizing the 11 carboxy-terminal amino acids of chicken EphA4 was generously provided by Dr. Elena Pasquale (The Burnham Institute, La Jolla, CA). The production and specificity of the antibody were previously described (Soans et al., [1994]). The monoclonal anti-S100 antibody was purchased from Sigma (St. Louis, MO). The rat anti-N-CAM monoclonal antibody (isoclone 12F11) was obtained from BD PharMingen (San Diego, CA). Fluorescein isothiocyante (FITC)-conjugated donkey anti-rabbit, Cy5-conjugated donkey anti-mouse, and Cy5-conjugated goat anti-rabbit antibodies were purchased from Jackson ImmunoResearch (West Grove, PA). AlexaFluor 568 hydrazide and AlexaFluor 568- and 488-conjugated goat anti-rat and anti-mouse secondary antibodies (highly cross-absorbed) were obtained from Molecular Probes (Eugene, OR). Dilithium salt of Lucifer Yellow CH (LY) was purchased from Calbiochem (La Jolla, CA).Intracellular labeling of astrocytes with fluorescent dyesIntracellular injection of astrocytes in lightly fixed tissue slices was performed as previously described, with some modifications (Buhl et al., [1990]). Male Sprague-Dawley rats, 1 month old, were deeply anesthetized with Nembutal (10 mg/100 g body weight). The animals were transcardially perfused with oxygenated Ringer's solution at 37C (0.79% NaCl, 0.038% KCl, 0.02% MgCl2 6H2O, 0.018% Na2HPO4, 0.125% NaHCO3, 0.03% CaCl2 2H2O, 0.2% dextrose, 0.02% xylocaine), followed by 4% paraformaldehyde (PFA) in PBS (pH 7.4, 37C) for 8-10 minutes. The brain was placed in ice-cold PBS and cut into coronal slices with a vibratome at a thickness of 100 m. The slices were stored in PBS at 4C until used.The slices were placed under a 60 water objective (NA 1.4) and observed with an Olympus BX50WI microscope using infrared-DIC optics (Olympus, Melville, NY). Astrocytes in the upper blade of the dentate gyrus were identified by the shape and size of their somata. Glass micropipettes (OD 1.00 mm, ID 0.58 mm; resistances 100-400 M) were pulled on a vertical puller (David Kopf Instruments, Tujunga, CA) and backfilled with either 5% aqueous LY or 10 mM AlexaFluor 568 in 200 mM KCl. Astrocytes were impaled and iontophoretically injected with dye using 1-second pulses of negative current (0.5 Hz) for 1-2 minutes. After several cells were filled, the slices were placed in ice-cold 4% PFA for at least 1 hour. The slices were then ready to be immunolabeled.ImmunohistochemistryFor S100 double-labeling with EphA4 or N-CAM, a 1-month-old male Sprague-Dawley rat was perfused as described above, except that the 4% PFA was perfused for 20 minutes. Vibratome slices were cut coronally at a thickness of 75 m. These slices and slices containing dye-filled astrocytes were immunolabeled as described below, with all steps performed at 4C.Slices were washed three times for 10 minutes each in PBS. The slices were incubated for 1 hour in blocking solution (PBS containing 3% normal goat serum, 1% cold water fish gelatin, 0.25% Triton X-100). Slices containing LY-filled astrocytes were then placed in working buffer (WB; PBS containing 0.3% normal goat serum, 0.1% cold water fish gelatin, 0.125% Triton X-100) containing either 7 g/ml EphA4 or 1:200 N-CAM antibody for 48 hours. Slices used in the somata distribution experiment were placed in WB containing 7 g/ml EphA4 or 1:200 N-CAM and 1:200 anti-S100. The slices were washed three times in WB for 10 minutes each and then placed in WB containing secondary antibodies at a concentration of 1:100 for 24 hours. For studying astrocyte morphology near boundaries, astrocytes near the EphA4 boundary were filled with LY, and astrocytes near the N-CAM boundary were filled with AlexaFluor 568. EphA4 was subsequently detected using goat anti-rabbit Cy5, and N-CAM was detected using goat anti-rat AlexaFluor 488. In S100-labeled slices, N-CAM was detected with AlexaFluor488, EphA4 was detected with FITC, and S100 was labeled with either Alexa568 or Cy5, respectively. Slices were washed in PBS three times for 10 minutes each. Slices were coverslipped using Gelvatol (Harlow and Lane, [1988]) and allowed to set overnight at room temperature before they were examined. Donkey serum was used throughout the procedure for double-labeled specimens.Image acquisition and analysisSpecimens were examined using a Radiance2000 laser scanning confocal system (Bio-Rad, Hercules, CA) attached to a Nikon E600FN microscope (Kanagawa, Japan). A 60 oil immersion (NA 1.4) objective was used to image LY-filled astrocytes, and a 40 oil immersion (NA 1.3) objective was used to image S100 double-labeled slices.Image visualization and analysis were performed using the program Imaris 2.7 (Bitplane, Zurich, Switzerland). Baseline subtraction and linear contrast stretch functions were performed on volumes to enhance contrast. Final images were prepared using Adobe Photoshop 7.0 (San Jose, CA). Images of astrocytes near boundaries were constructed by combining an average intensity projection of either EphA4 or N-CAM labeling with a maximum intensity projection of the LY- or AlexaFluor 568-filled astrocyte.Histograms and graphs were generated using KaleidoGraph (Synergy Software, Reading, PA). All results are provided as mean SEM. Linear weighted sum (LWS) equals P (count)dp. The degree of polarization (P) was calculated by measuring the maximum extent of processes from the center of the soma toward the pia and toward the stratum granulosum and then dividing the larger value by the smaller. Astrocytes with longer pia-directed processes were given a positive value, and astrocytes with longer stratum granulosum-directed processes were given a negative value. Astrocyte spatial arrangement was tested for nonuniform distribution by means of a bootstrap procedure (Romano, [1989]). Briefly, the calculated Cramr-von Mises (CvM) goodness-of-fit value for the empirical data was compared with the CvM value obtained from 10,000 pseudo-samples (each with a sample size equal to tested dataset), each randomly generated by drawing from the null (uniform) distribution. The resulting P value equals the number of pseudo-samples having CvM values greater than the CvM value of the actual sample, divided by 10,000.
Imaging product type
Type
Optical section
Cutting plane
transverse
Z resolution
0.28 um
Citation Information
Eric Bushong, Maryann Martone, Mark Ellisman (2000) CCDB:3800, rattus norvegicus, protoplasmic astrocyte. CIL. Dataset. https://doi.org/doi:10.7295/W9CCDB3800